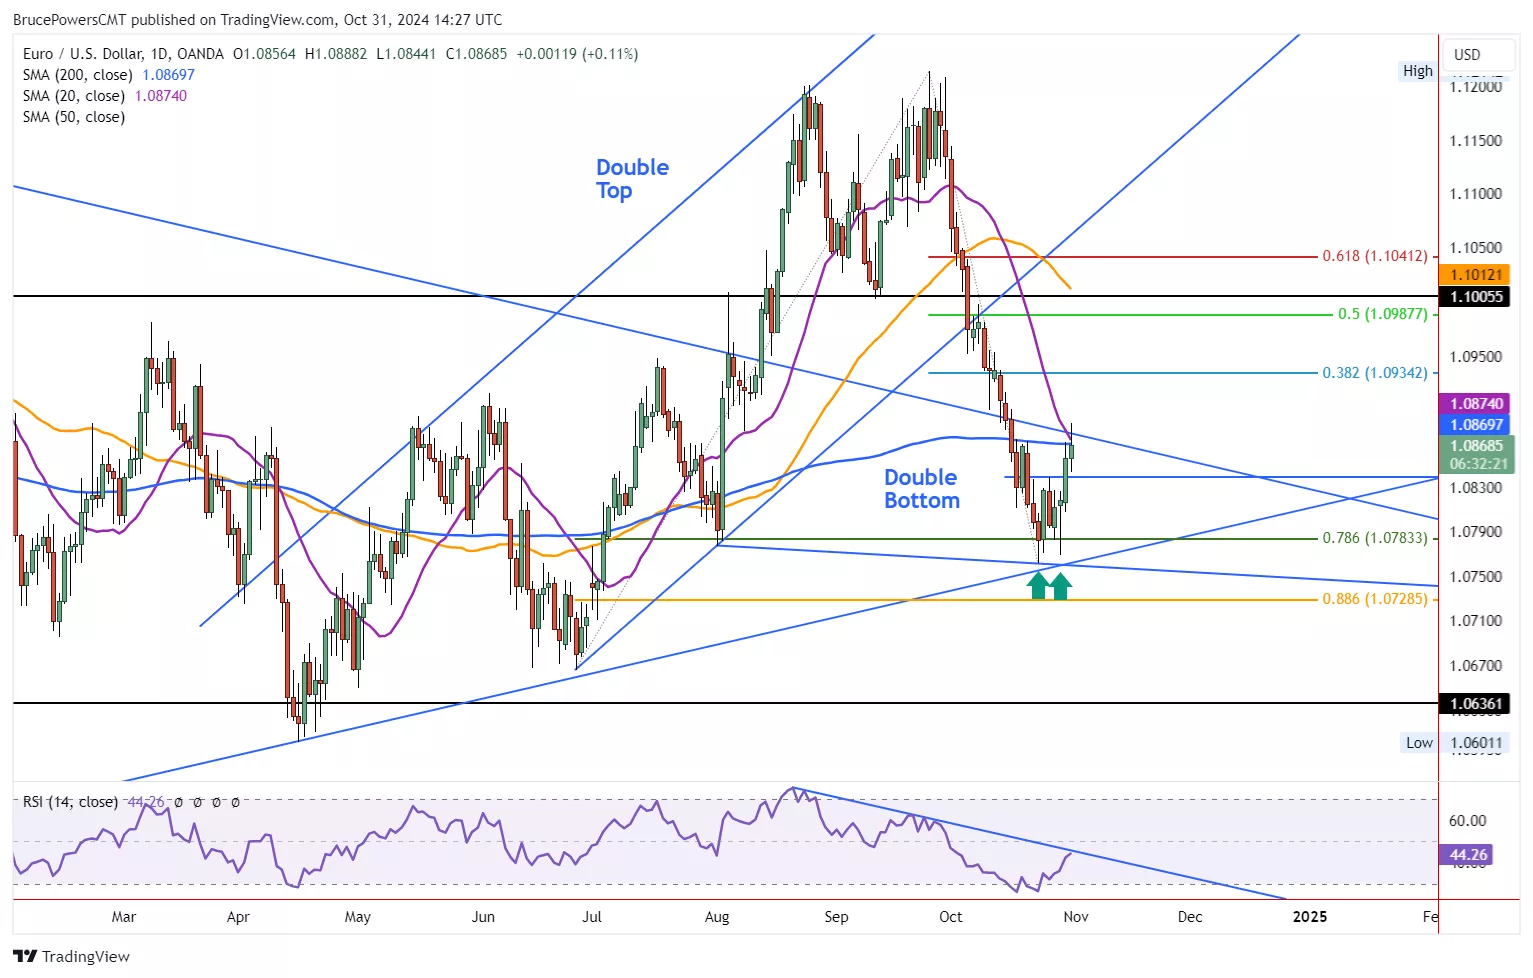
A bullish double bottom reversal pattern triggered in the EUR/USD on Wednesday indicating a potential change in trend. During Thursday’s session strength was confirmed with a breakout above both Wednesday’s high and the 200-Day MA at 1.0870, thereby preparing the stage for a continuation higher. Whether that happens before or after a pullback remains to be seen.(Click on image to enlarge)
A daily close above the 200-Day MA would provide another bullish indication. An initial upside target derived from the double bottom is at 1.0917. It is followed by the 38.2% Fibonacci retracement at 1.0934. A little higher is the 50% retracement zone at 1.0988. Certainly, the neckline of the recent double top at 1.1055 could also be tested as resistance eventually as well.Key support for the EUR/USD is at the neckline of the double bottom at 1.0839, followed by support from Wednesday at 1.0808. Notice that the recent decline found support at a low of 1.0761, which is around the convergence of the 78.6% Fibonacci retracement and a long-term uptrend line. It followed a relatively sharp 20-day decline in the pair. In other words, there were technical reasons indicating a possible bottom. That bottom subsequently evolved into a double bottom. Therefore, a pullback should eventually resolve itself to the upside.


