This article summarizes additional data about possible noise in the Fed Funds Rate (FFR) and CPI Inflation data from 1951 to 2024. This examination was y.1,2
 Image by from . IntroductionWe previously examined specific examples of the effects of smoothing monthly data on possible noise removal from month-to-month changes in FFR and CPI1 and year-over-year changes.2Recently,3 it was shown that there were minor differences in the variation of year-over-year inflation over a long period (1951-2024) between quarterly data and 3-month moving average (MA) monthly data. We leave the question of which data is best for another time. (If they produce similar results, the analysis process is simplified with quarterly data.)Here, we will look further at the possibility of noise differences impacting results between month-over-month changes in FFR and CPI compared to monthly year-over-year changes.We will also examine how using different moving averages to smooth monthly data might reduce the impact of noise.
Analysis
Sep 2009 – Oct 2011Previous Example of Noise Overwhelming Calculated Correlation1
From September 2009 to October 2011, CPI inflation increased from -1.6% to +3.7%, a rise of 5.3%, or by a different calculation, from -2.3% to +5.6%, a rise of 5.7%.3 During these 26 months, the Fed made no change in interest rates. The Fed Funds Rate remained at 0-0.25% the entire time.4 However, there were minor variations within the range. The monthly values ranged from 0.07% to 0.20%. The monthly changes ranged from -0.02% to +0.04%. In Figure 1, the change for each month is the 3-month-moving average, and the range is -0.02% to +0.03%.
Figure 1 and Figure 2 are from the previous example.
Figure 1. FFR and CPI, Monthly Changes, 3-Month MA, Sep 2009 – Oct 2011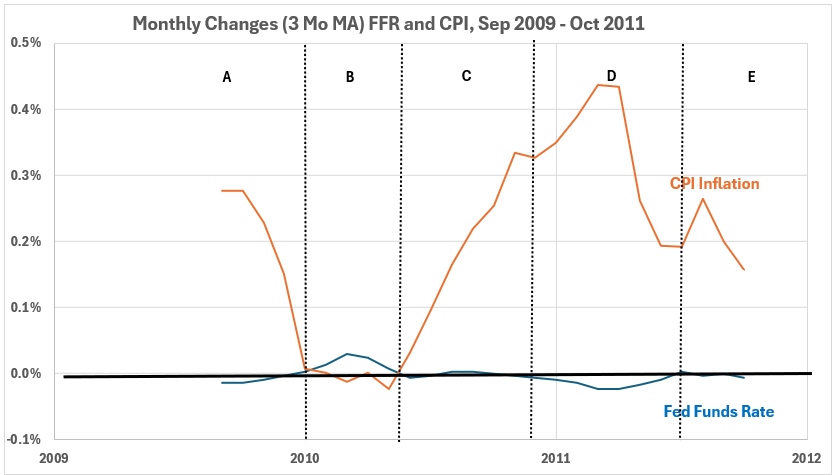
Figure 2. Monthly Changes in Fed Funds Rate (x) vs. CPI Inflation (y), Sep 2009 – Oct 2011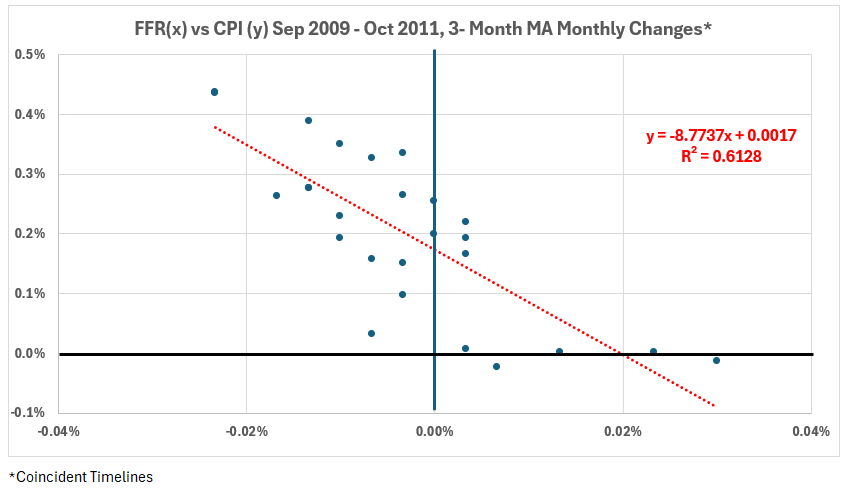
The question was raised: how much do the functionally meaningless minor fluctuations in FFR contribute to the significant negative correlation in Figure 2?Using Year-over-Year Changes Instead of Monthly ChangesUsing the same 3-month MA data, we have calculated the monthly variations of year-over-year changes in FFR and CPI (Figure 3). The scatter diagram for this data is in Figure 4.
Figure 3. FFR and CPI, YOY Changes, 3-Month MA, Sep 2009 – Oct 2011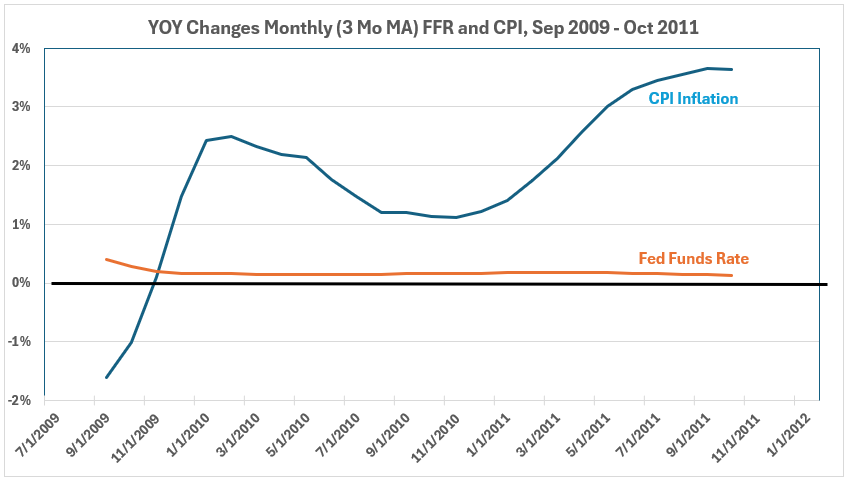
Figure 4. YOY Changes in Fed Funds Rate (x) vs. CPI Inflation (y), Sep 2009 – Oct 2011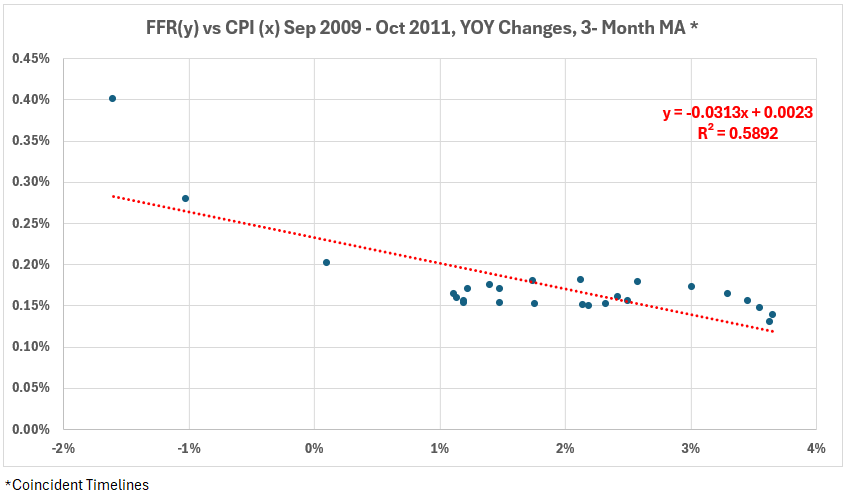
Observations:
Because the FFR remained unchanged during this period, the significant negative association can not be considered evidence that changing FFR can change inflation. There is no logical basis for suggesting that maintaining FFR unchanged caused a decline in CPI (negative association)—CPI increased over this interval. Thus, the rational interpretation of the significant negative association is that FFR did not affect inflation over this period.Added note:If one eliminates the first two points on the left in Figure 4 as possible outliers, the trend line equation becomes y = -.0087x + 0.0018 with R2 = 29% (R = –54%). The significant association without the two points is reduced to moderate, just above the R2 = 25% dividing line between moderate and weak associations.
Is There an Optimal Moving Average for the Monthly Data?
So far, we have used only 3-month moving averages to smooth the monthly data. Let’s examine what happens with other moving averages. We evaluate no smoothing, 2-month, 3-month, and 4-month smoothing.1955 – 2024Previously,2 the YoY changes have been shown for both CPI and FFR with no smoothing of the monthly data, plus 2-month, 3-month, and 4-month smoothing. Here, we show the correlations for all combinations of this smoothing array. These combinations can be written as C(FFRi,CPIj), where i and j each assume all the values from 1 to 4. There are sixteen combinations:C(FFR1,CPI1), C(FFR1,CPI2), C(FFR1,CPI3), C(FFR1,CPI4), C(FFR2,CPI1), … C(FFR3,CPI4), C(FFR4,CPI4)Table 1 shows the correlation coefficients (R) for all sixteen combinations.Table 1. Effects of Smoothing FFR and CPI Monthly Data on YoY Correlation, 1955-2024
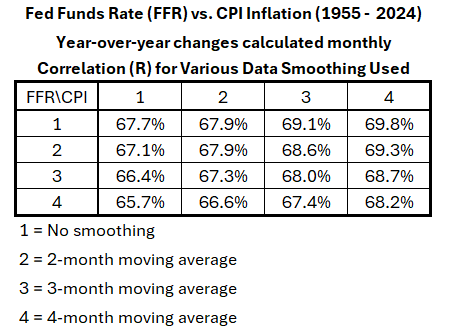 All the results fall between R = –65.7% and –69.8%. For the uncertainty associated with the data and analysis, one should not argue that these results are significantly different.
Sep 2009 – Oct 2011Table 2 shows the results when the data for a short period is analyzed.Table 2. Effects of Smoothing FFR and CPI Monthly Data on YoY Correlation, 2009-2011
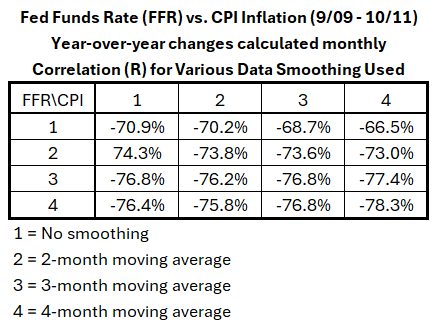
In Table 2, R ranges from –66.5% to –78.3%. There are possibly significant differences here, with R2 ranging from 44% to 61%. The results in rows 2, 3, and 4 range from –73% to –78.3%. The range of R2 values is narrower, 53% to 61%. This suggests that unsmoothed data for FFR in this period should not be used. Looking at rows 3 and 4, R ranges from –76.2% to –78.3% (R2 from 58% to 61%). This implies that any smoothing for CPI is acceptable for this period, but 3- or 4-month moving averages should be used for FFR.
Conclusion
Data smoothing did not significantly change the correlation between FFR and CPI for the entire data set. If noise is present, it is random and cancels out over a long time. However, in the short interval examined, the results suggest that noise may be a problem with the FFR data. For this reason, we will continue to use 3-month moving averages for YoY analysis.Next week, we return to setting up the monthly data’s timeline offset tables for the Fed Funds rate and CPI. We will continue using FFR as the dependent variable and CPI as the independent variable. Footnotes1. Lounsbury, John, “, December 1, 2024.
2. Lounsbury, John, “,” EconCurrents, December 8, 2024.
3. Lounsbury, John, “,” EconCurrents, December 8, 2024.
4. Federal Reserve Economic Data, . Data downloaded September 18, 2024. Fed Funds Rate And Inflation: NoiseFed Funds Rate and Inflation. Part 2Fed Funds Rate and Inflation. Part 1


