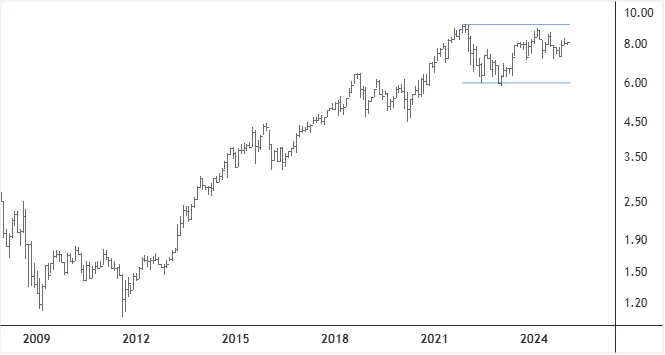
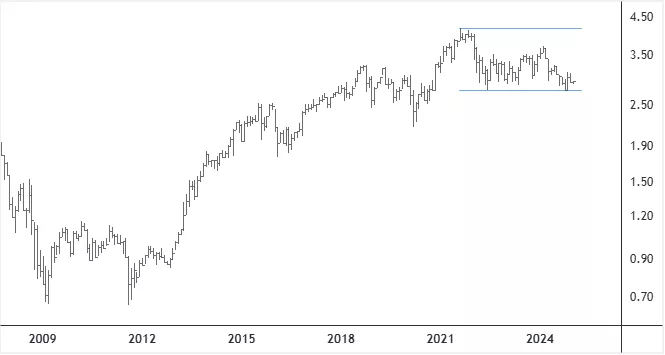
The Nasdaq 100 Index is up about 2,000 per cent, more than 20-fold, from its lowest value in November 2008. Its equal weight version is up about 1,200 per cent, almost 14-fold, over the same period.Both indices have overall outperformed the spot price of gold in recent years. That may be changing.The monthly charts below show the ratios of the levels of the two indexes against gold´s spot price. If the ratios fall decisively below the lower blue horizontal lines, then the market-cap and equal-weight indices could decline sharply and possibly set the price of gold up for a rise above $2,800 per ounce. As of now, the ratio of the equal weight index vs. gold is more vulnerable to a break to the downside. Monthly Chart – Nasdaq 100 Market-Cap versus Spot Price of Gold(Click on image to enlarge) Monthly Chart – Nasdaq 100 Equal-Weight versus Spot Price of Gold(Click on image to enlarge)


