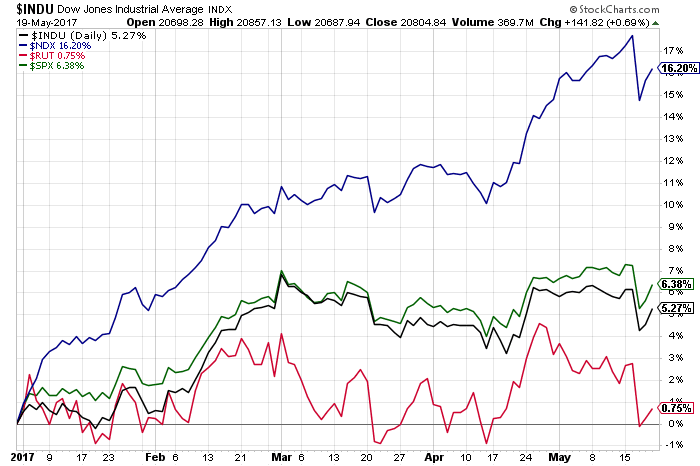
From the Year-to-date comparison chart below of the 4 Major Indices, it’s easy to see that the Nasdaq 100 Index has led this year’s equity rally by a wide margin, while the Russell 2000 Index is, essentially flat, after a couple of foiled attempts to gain any traction.
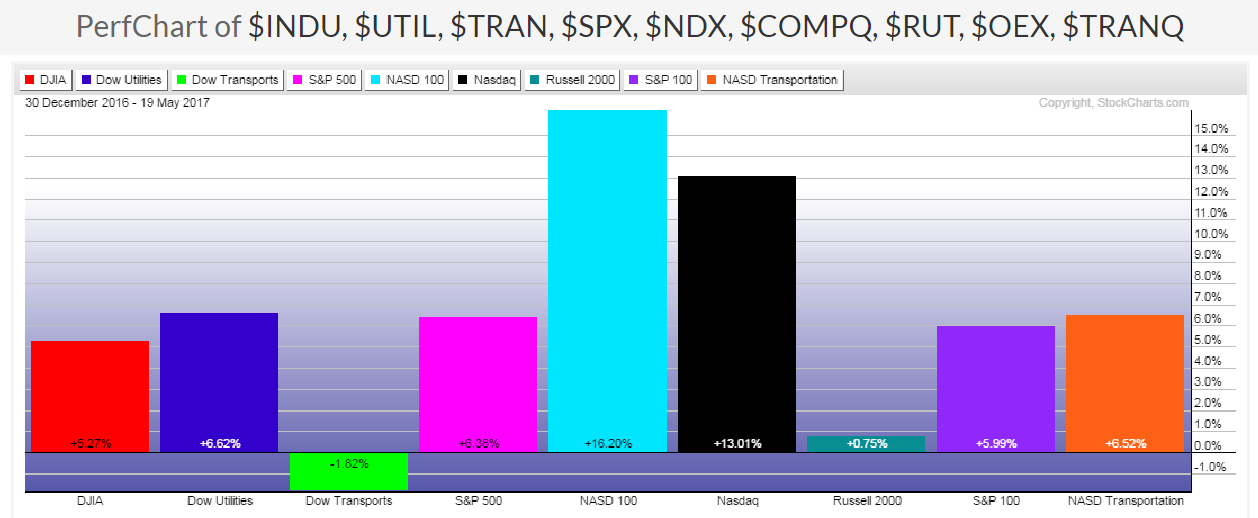
If the aim of President Trump’s proposed health care plan, deregulation on businesses, tax cuts, and tax reform is to help small business owners, market players don’t seem to be buying into that because of their rejection of small-cap stocks, so far, this year, as also depicted on the Year-to-date graph of the 9 Major Indices below.
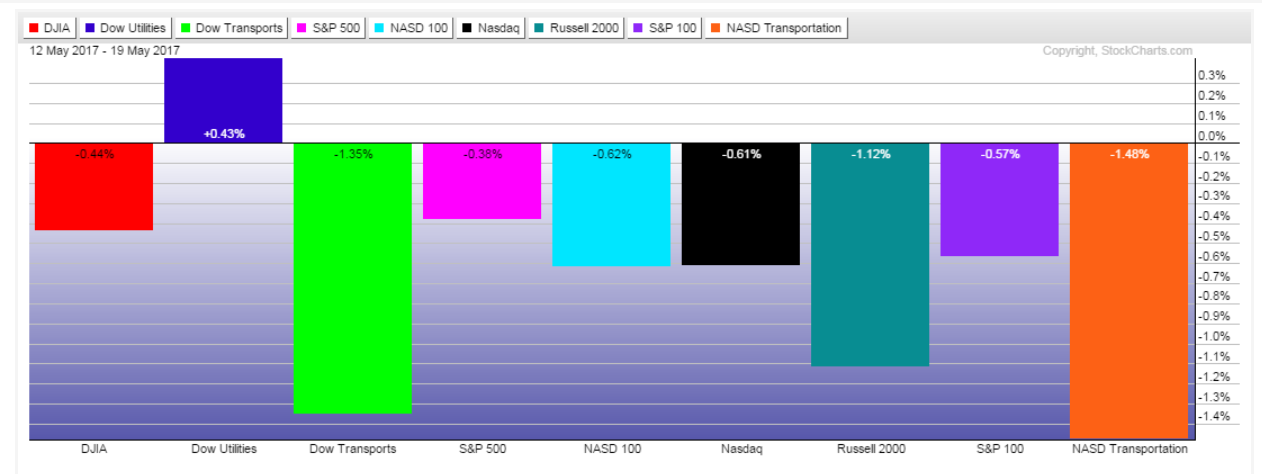
In fact, money flowed out of small caps this week (along with most of the 9 Major Indices, as shown on the 1-week graph below.
Furthermore, if the economy is doing so well and the Fed is busy raising interest rates (with the promise of more to come this year), why is the Financials sector flat this year, as shown on the following Year-to-date graph of the 9 Major Sectors?
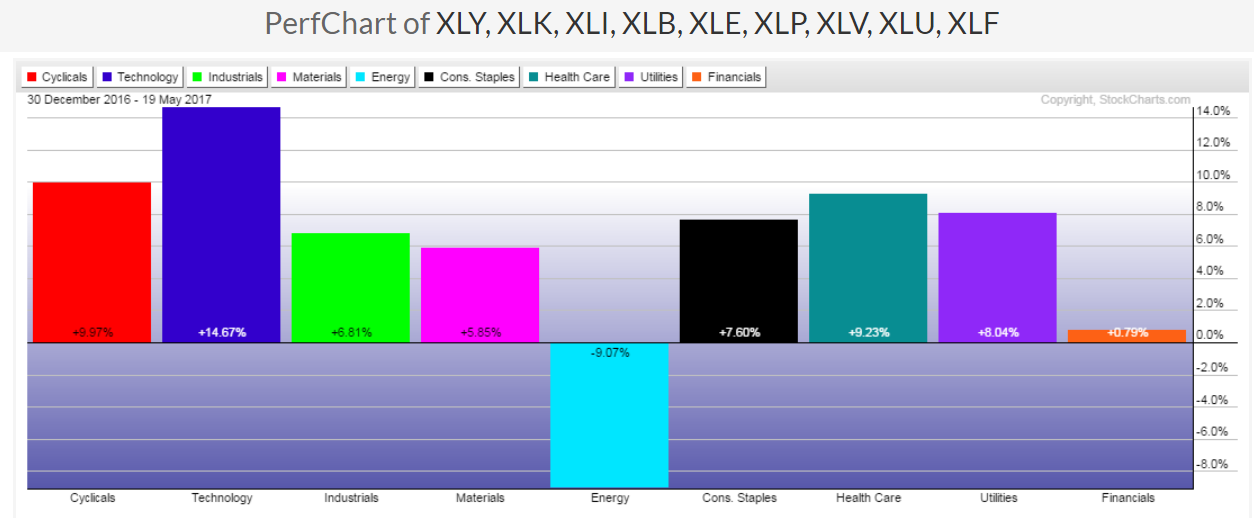
In fact, money flowed out of Financials this week (along with most of the 9 Major Sectors, as depicted on the 1-week graph below.)
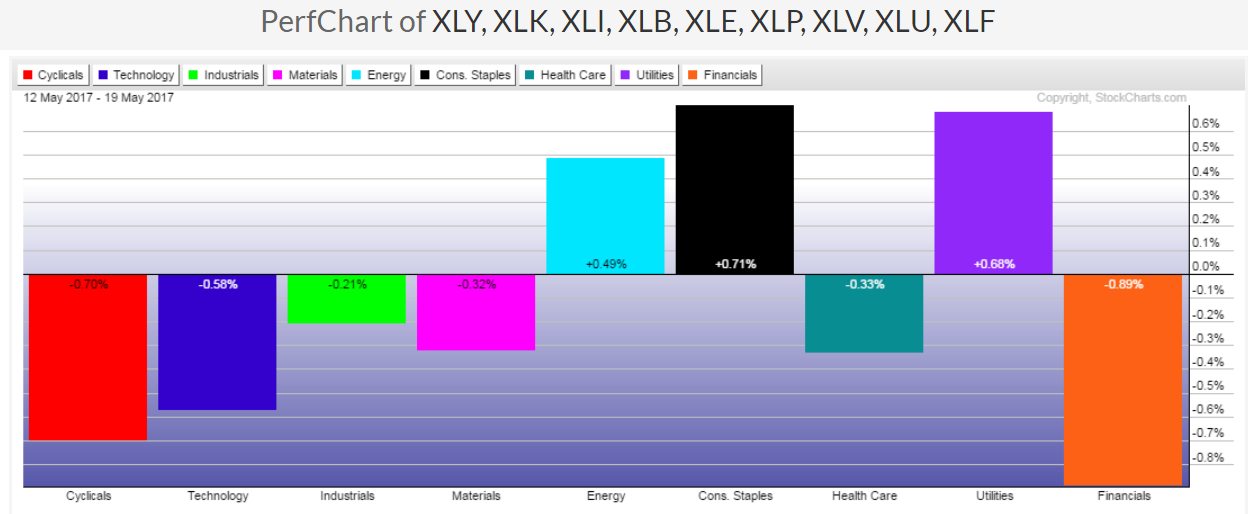
We’ll see if the coming weeks present any buying opportunities for small-cap stocks and for the Financials Sector. Further weakening of these could negatively impact medium and large-caps stocks. However, Technology still holds the key to overall equity strength, in my opinion, as I described in my post of April 30.
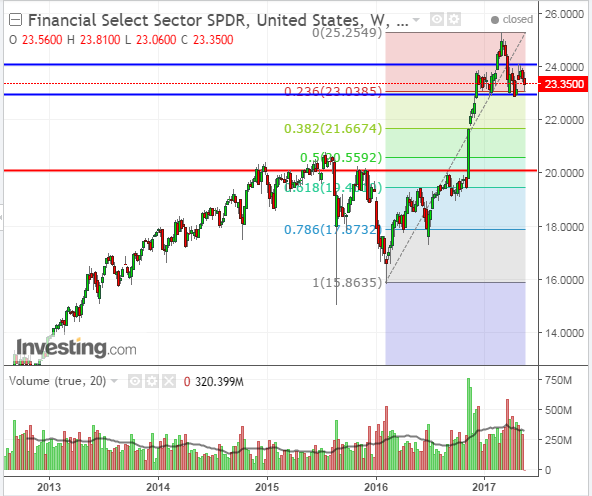
At the moment, the Financials ETF (XLF) is threatening to break below the neckline of a Head & Shoulders pattern, as shown on the Weekly chart below. A drop and hold below 23.00 could see a swift plunge down to major support at 20.00, or lower.
