Gold has been massively outperforming the rest of the PM complex for quite some time, but that all began to change since the first of January this year. I know how frustrating it has been for precious metals stock investors to see gold going up while the precious metals stocks were languishing, showing very little desire to move up with gold.If you’ve been trading in the PM complex for many years, then you know that eventually the PM stocks will have their day to shine, which is now beginning to take place to the disbelief of many. Is this current rally just another flash in the pan, or is there something much more powerful underlying this current rally in the PM stocks? The Chartology is strongly suggesting that the PM stocks are only in the opening stage of what could be a very long and powerful bull move.Let’s start with an area that has been lagging the rest of the PM complex: the small and micro-cap PM stocks, where many are traded on the CDNX, Canadian Venture Composite Index. After following this inverse H&S bottom for some time, this week we are finally seeing the CDNX breaking out from the 2 1/2 year inverse H&S bottom. For small and micro-cap lovers, this is a big deal.(Click on image to enlarge)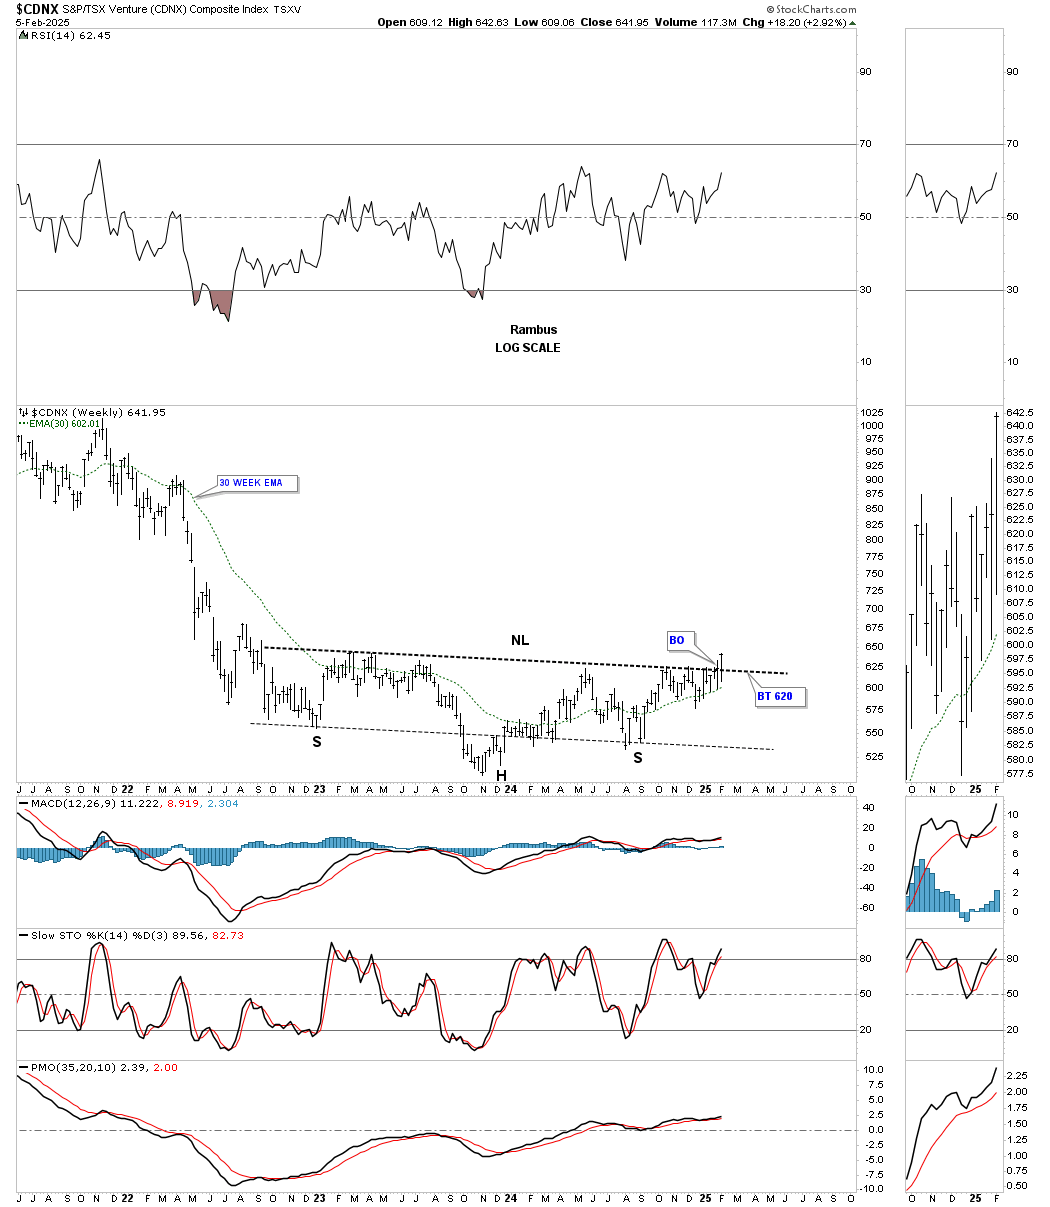 To put that H&S bottom on the weekly chart above into perspective, below is the history chart for the CDNX, which shows how the current inverse H&S reversal pattern fits into the very big picture on the far right-hand side of the chart. If there was ever a place to look for some type of reversal pattern, this is it.(Click on image to enlarge)
 Since the bear market low in 2016, most of the PM stock indexes have only formed two important consolidation patterns: the 2016 bullish falling wedge and the 2020 bullish expanding falling wedge, as shown on this weekly chart for the HUI. Those two large consolidation patterns have formed the 2016 parallel uptrend channel, which is part of the 2000 secular bull market uptrend channel.The backtest to the top rail of the 2016 blue bullish falling wedge formed a classic H&S bottom, with the left shoulder low and head forming inside the falling wedge, and the right shoulder low forming on the backtest to the top trendline.The 2020 blue bullish expanding falling wedge shows the red bullish falling wedge forming the backtest to the top trendline – classic Chartology.(Click on image to enlarge)
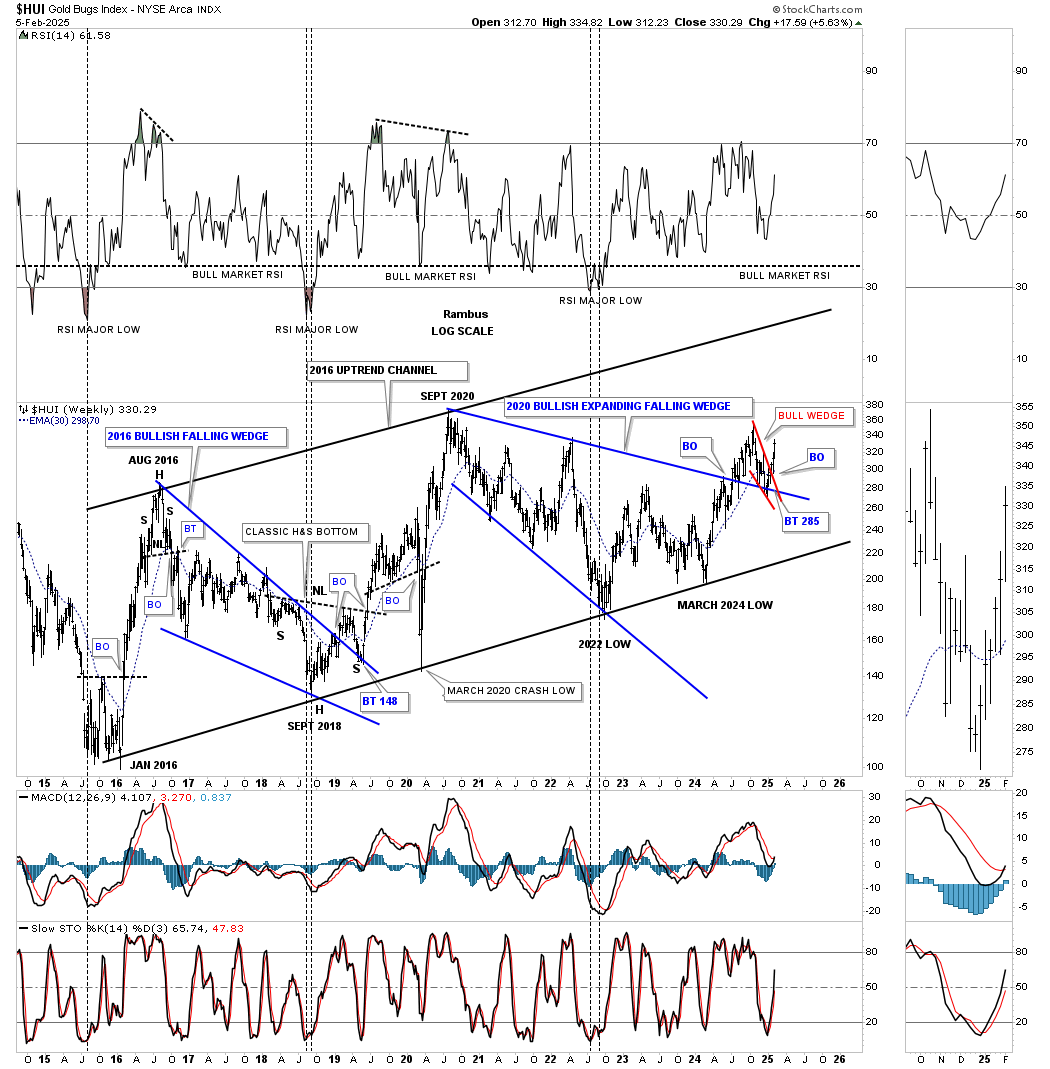 This history chart for the HUI shows all the important chart patterns it has formed during the 2000 secular bull market parallel uptrend channel.This is what I wrote in the 2nd paragraph and last sentence of this post: “The Chartology is strongly suggesting that the PM stocks are only in the opening stage of what could be a very long and powerful bull move.”As you can see, the breakout and backtest to the top rail of the 2020 bullish expanding falling wedge is now complete, which opens the door for a very powerful rally to the center dashed midline at a minimum before another important consolidation pattern begins to build out. At some point in the future, I expect to see the top trendline of the 2000 secular bull market to be achieved. I’ll let the fundamentalists come up with the reason why that is possible.(Click on image to enlarge)
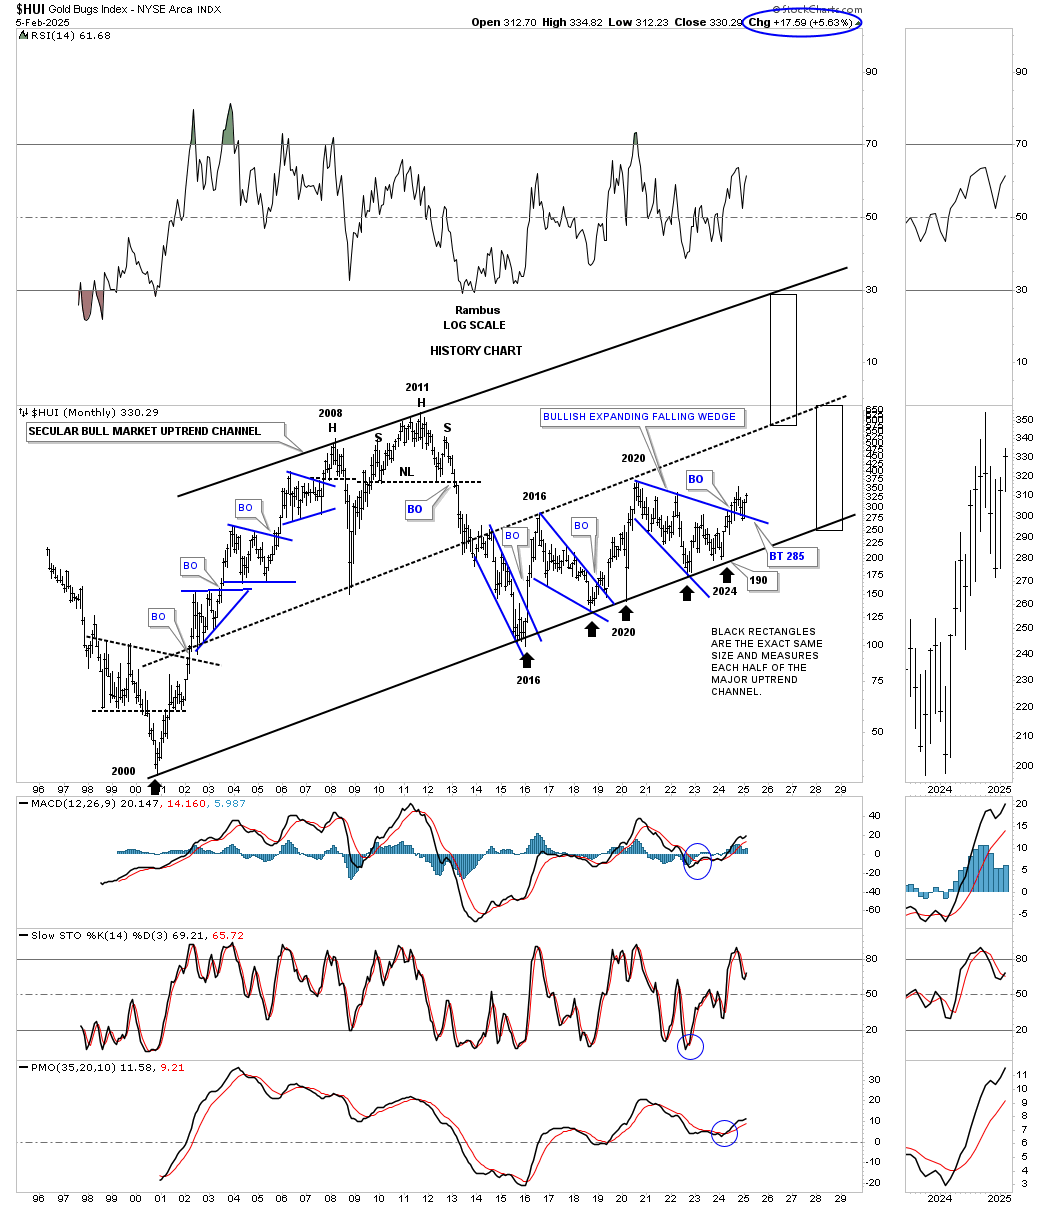 There is an important adage in Chartology that states: big chart patterns lead to big moves. If one is looking at an hourly chart and sees a nicely defined triangle, for instance, the impulse move will be relative to that triangle.On the other hand, if one finds a 13-year triangle on a weekly chart, the impulse move will be relative to that pattern. Below are just two examples of the 2011 triangle consolidation patterns that we’ve been following, which show the breakout and backtest completing to the top trendline. I know it seems impossible that these 2011 triangle consolidation patterns will play out, but these aren’t the only large consolidation patterns that have formed in the PM complex.(Click on image to enlarge)
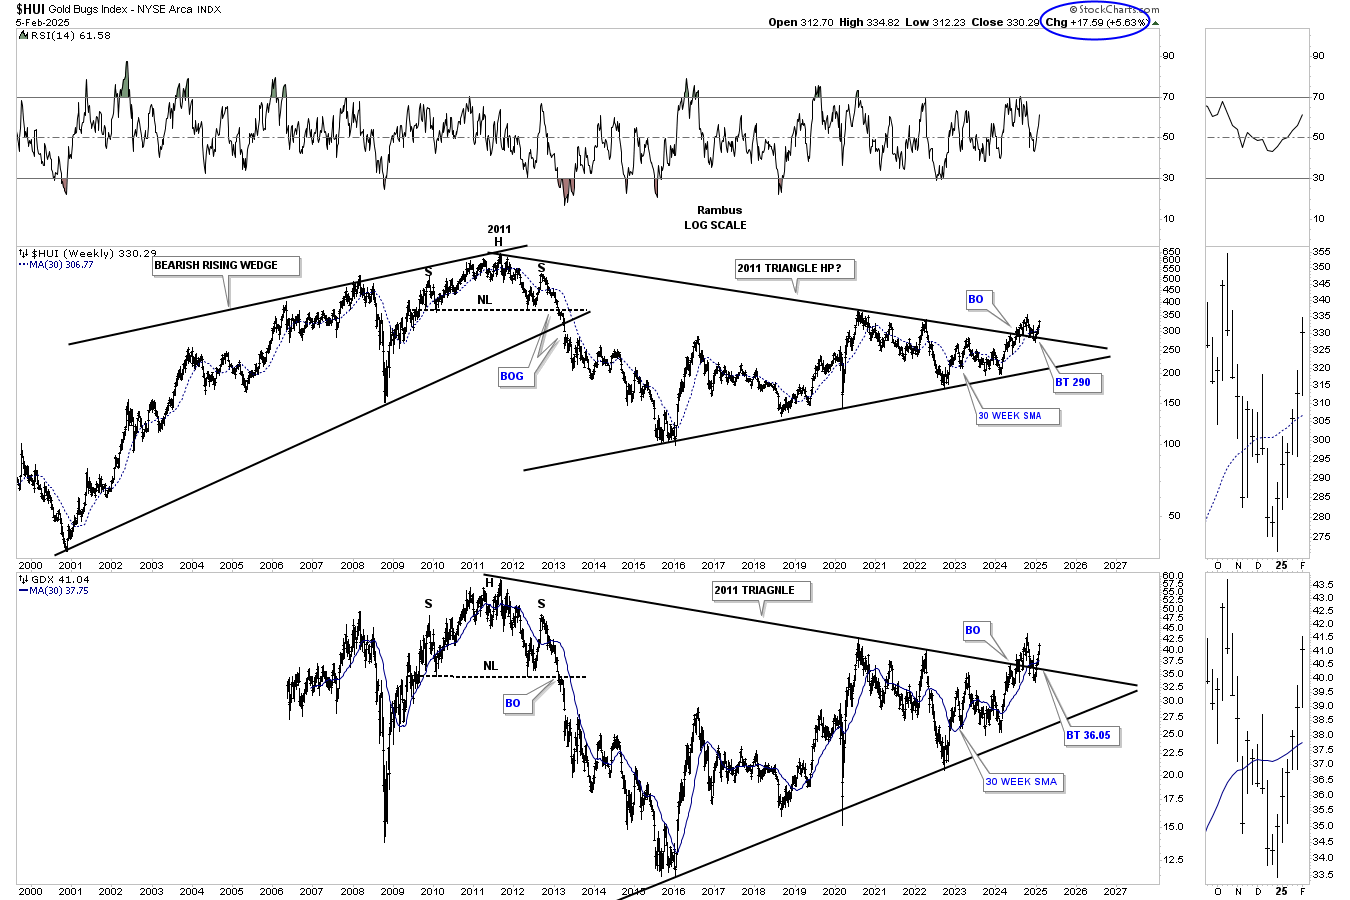 Gold has been trading in a nice parallel uptrend channel since the October 2023 low, forming three consolidation patterns along the way. Note the strong impulse move between each consolidation pattern. Gold has been moving strongly upward since breaking out from the most recent triangle consolidation pattern, so some type of small consolidation pattern may form before the top rail of the 2023 uptrend channel is reached, which would put gold over $3000 an ounce.(Click on image to enlarge)
 The strong impulse move that began on the left side of the chart at the 2018 low formed three distinct blue consolidation patterns before topping out at the August 2020 high. Several weeks ago, gold completed its third consolidation pattern, if we count the H&S consolidation pattern, which formed just below the top rail of the black 2020 bullish flat-top expanding triangle. Generally, two or three consolidation patterns in a strong rally phase is about all you get, with an outside chance of four, which is a bit of a stretch. When this current rally phase ends, we’ll see another, much larger, consolidation pattern start to form, which will be much larger than the blue consolidation patterns we see now.(Click on image to enlarge)
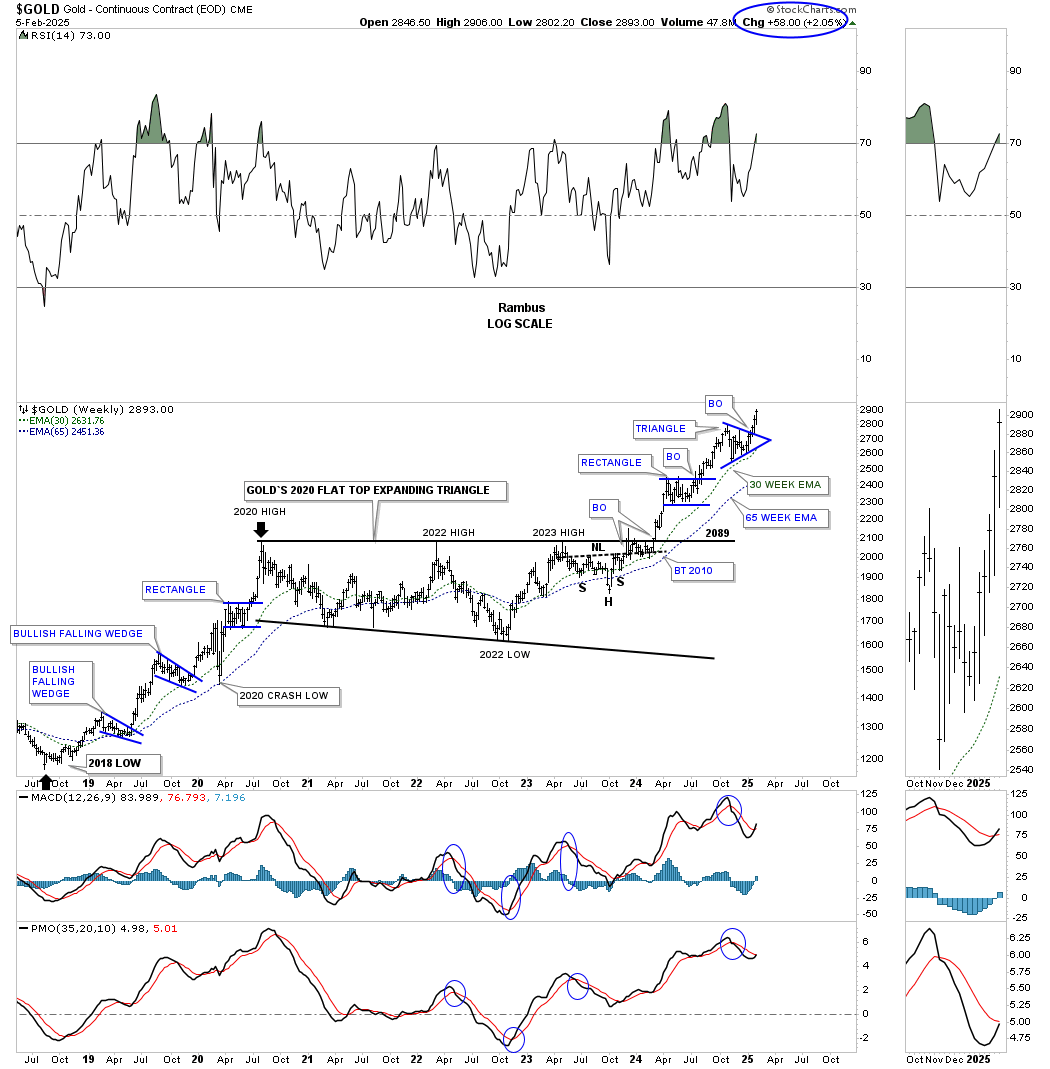 This weekly line chart for gold shows us another perspective, which is classic Chartology. After putting in the right shoulder low in that multi-year H&S consolidation pattern, the long black arrow shows the time and price it took to reach the rally high in 2020. After gold put in its 4th reversal point in the 2020 bull flag, because this is a line chart and not a bar chart, note how the long black arrow—which is the exact same long black arrow in the first leg up into the 2020 high—nailed the initial high, as shown by the blue arrows, in both time and price. Now, gold has started another impulse move higher, with a minimum price objective above $3000 an ounce.(Click on image to enlarge)
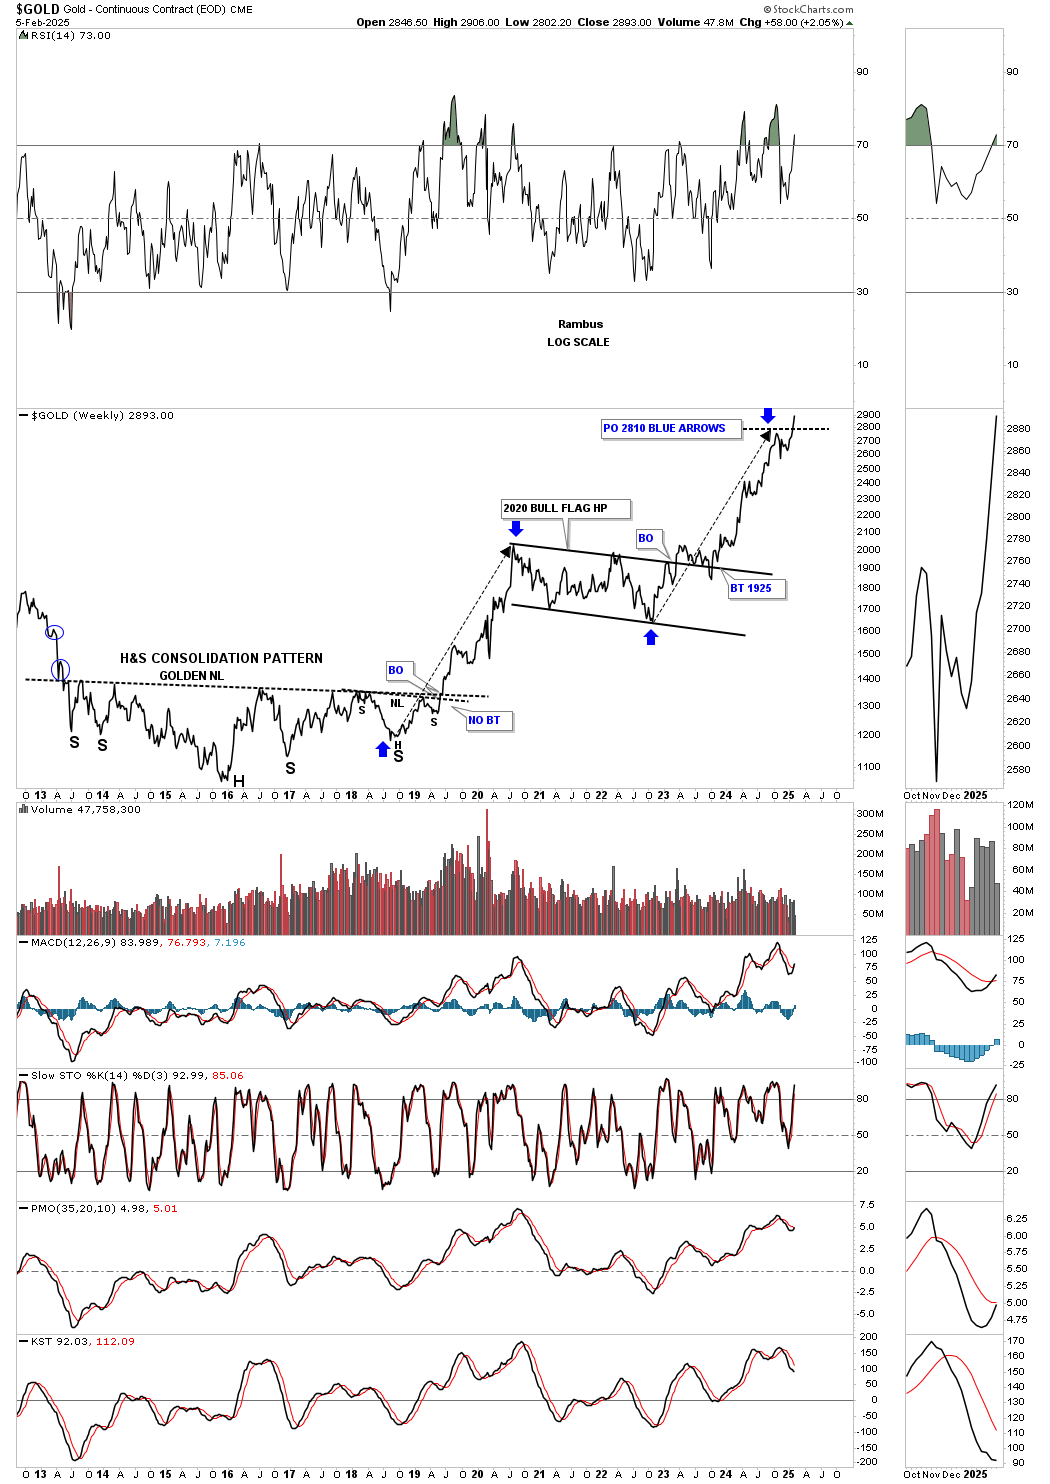 Next is the monthly chart, which goes all the way back to the 2008 crash low formed a very symmetrical H&S consolidation pattern, which led gold to its all-time high in August 2011, ending that phase of the bull market. Since the breakout of its 2020 flat-top expanding triangle, gold has enjoyed a nice, strong impulse move up, with the 10 and 20 month EMAs offering long-term support if needed.(Click on image to enlarge)
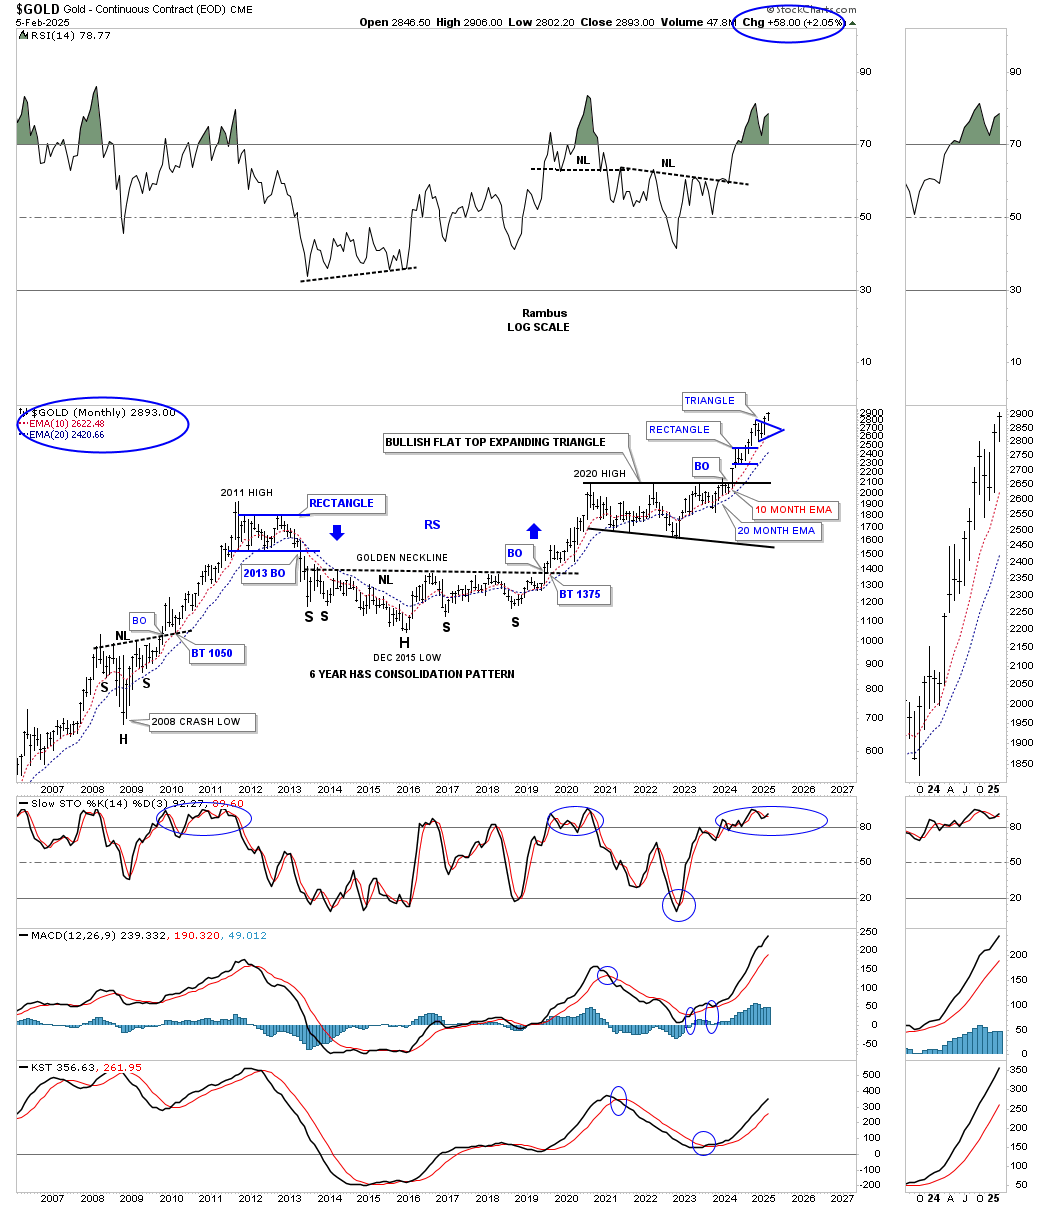 Gold’s secular bull market, which began at the 2000 bear market low, is still alive and well 25 years later, forming a new all-time high.(Click on image to enlarge)
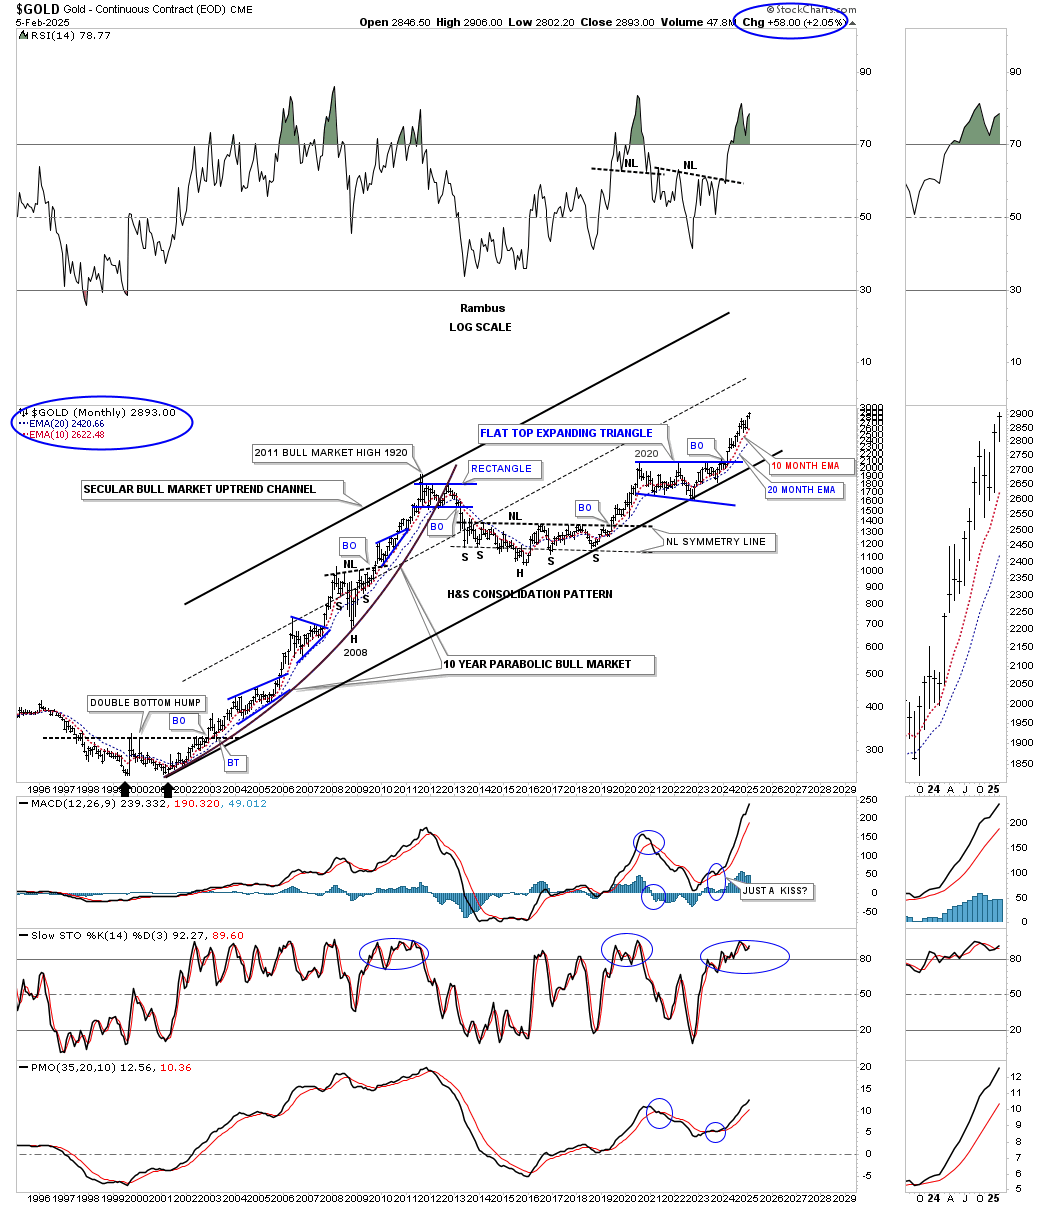 Let’s now look at several long-term quarterly charts, which really paint how bullish gold is and has been since the secular bull market began at the 2000 low. What I did on this quarterly bar chart was put a thin black rectangle around the late 1990s/2000 base, which shows time and price, and added it to the multi-year 2016 H&S consolidation pattern. My reasoning was that if that big base, which formed at the 2000 low, was almost identical in time and price to the 2016 H&S consolidation pattern, then gold should have enough energy to launch a similar 11-year bull market. As you can see, that scenario has been playing out beautifully since the right shoulder low.(Click on image to enlarge)
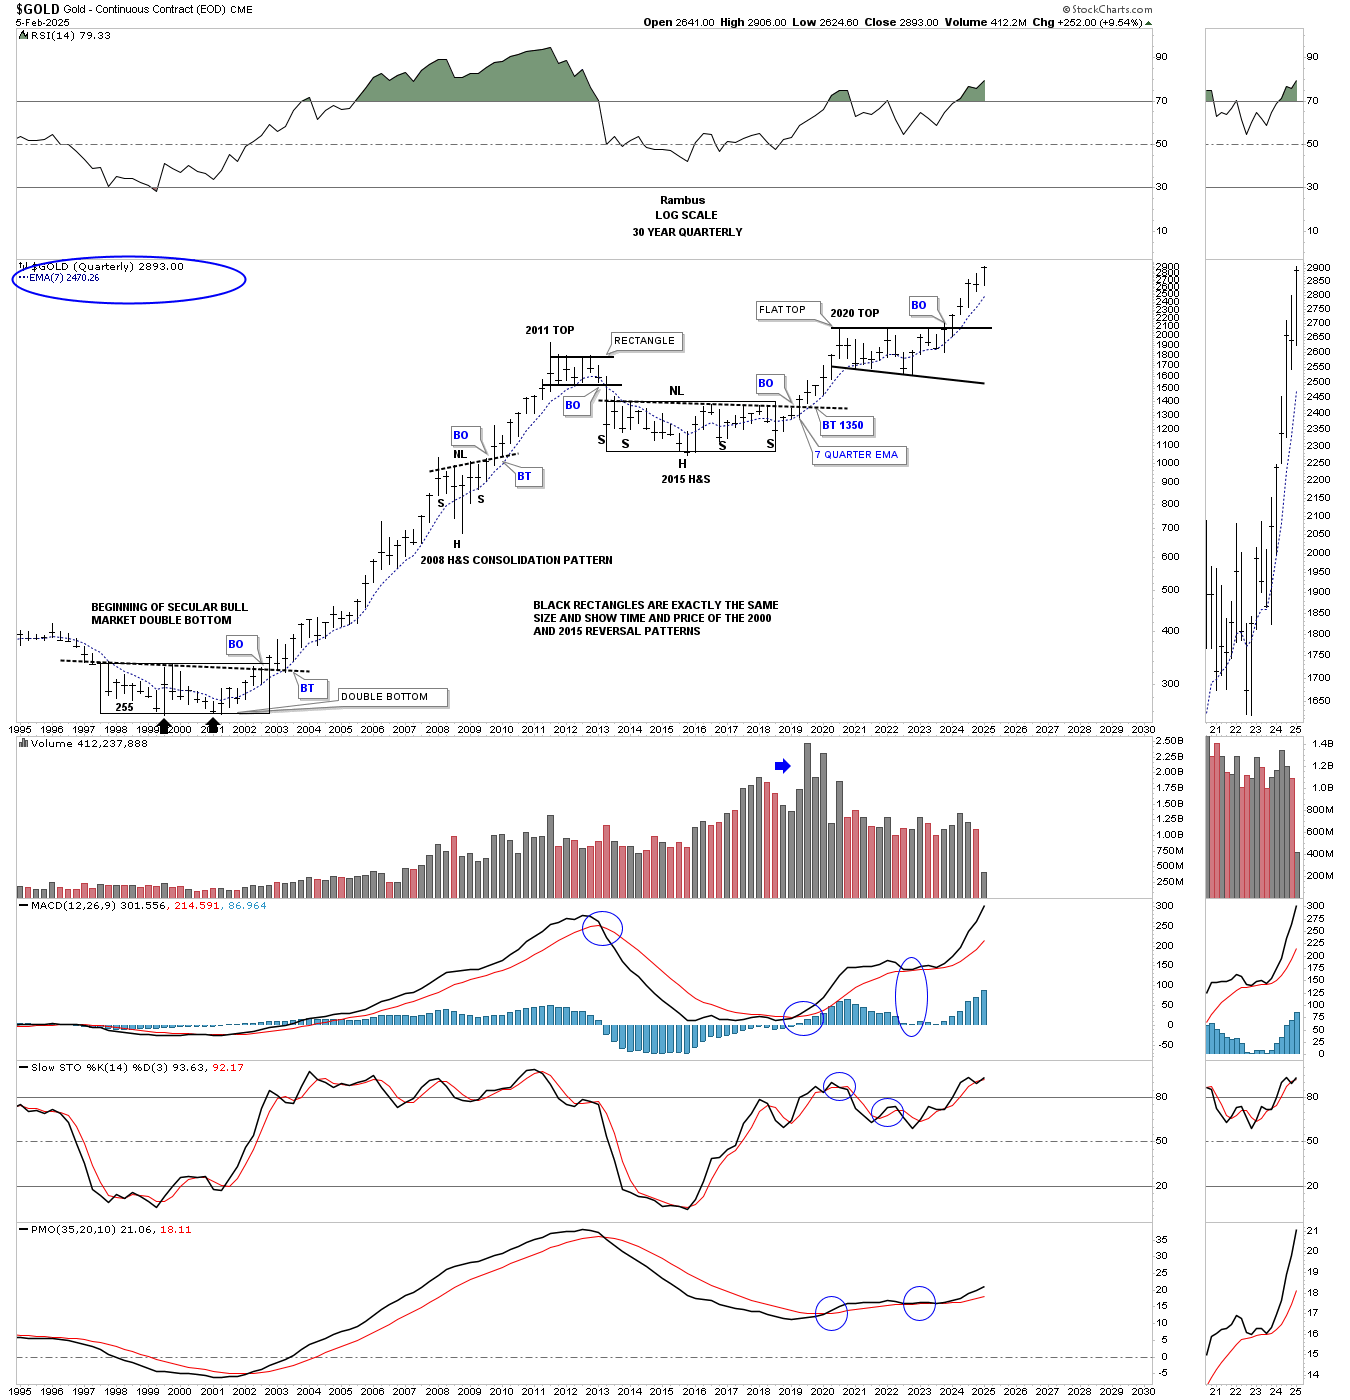 At the end of December 2024, gold showed a very small decline, as shown on this quarterly line chart. For the month of January, you can see that gold began moving higher once again in a nice, smooth quarterly line chart rally. If you compare the current rally out of the expanding triangle—because this is a quarterly line chart and not a bar chart—you can see that this is the strongest, most vertical rally gold has experienced since the secular bull market began in 2000. Outside of the rally that led to the top in 1980, you are witnessing the second-strongest rally in the history of gold.(Click on image to enlarge)
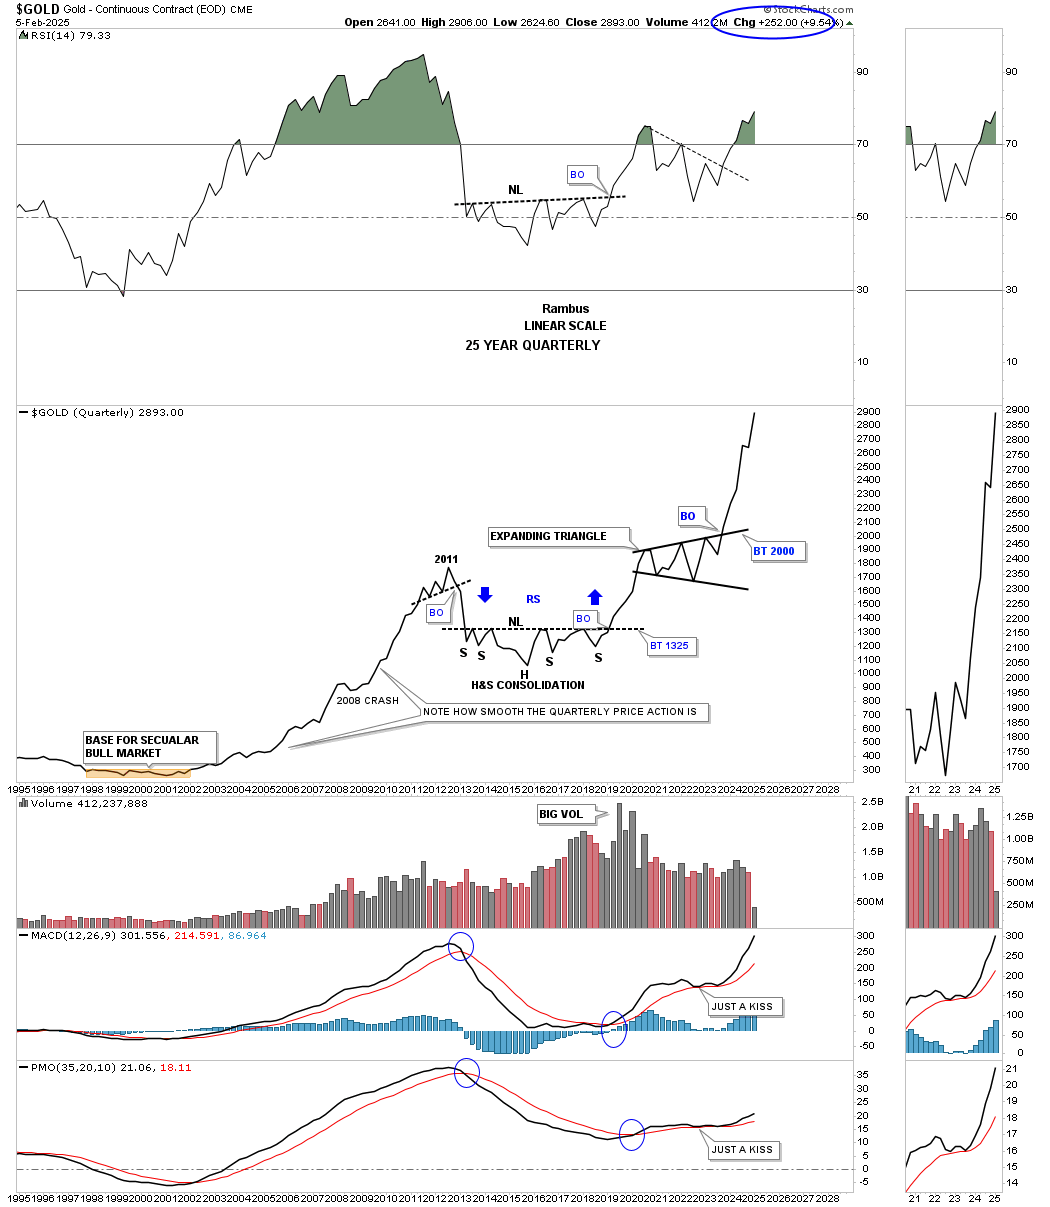 To really put gold’s bull market into perspective, below is a 50-year quarterly bar chart, which shows the 1980 high and the 20-year bear market that followed, ending at the 2000 low. That 20-year bear market formed a massive bullish falling wedge, which led to the current secular bull market that ran from the 2000 low to the 2011 high. From the 2011 high, gold went on to form the bullish rising wedge, which I’ve been calling a halfway pattern.The long black arrows measures time and price, and so far, the angle of the 2000 to 2011 bull market is the same as the current rally phase, beginning at the blue arrow low. The current rally phase is actually a bit stronger than the 2000 to 2011 rally, as the current price action is sitting on top of the long black arrow. What are the odds that gold will top out at $12,100 in 2033? Only time will tell.(Click on image to enlarge)
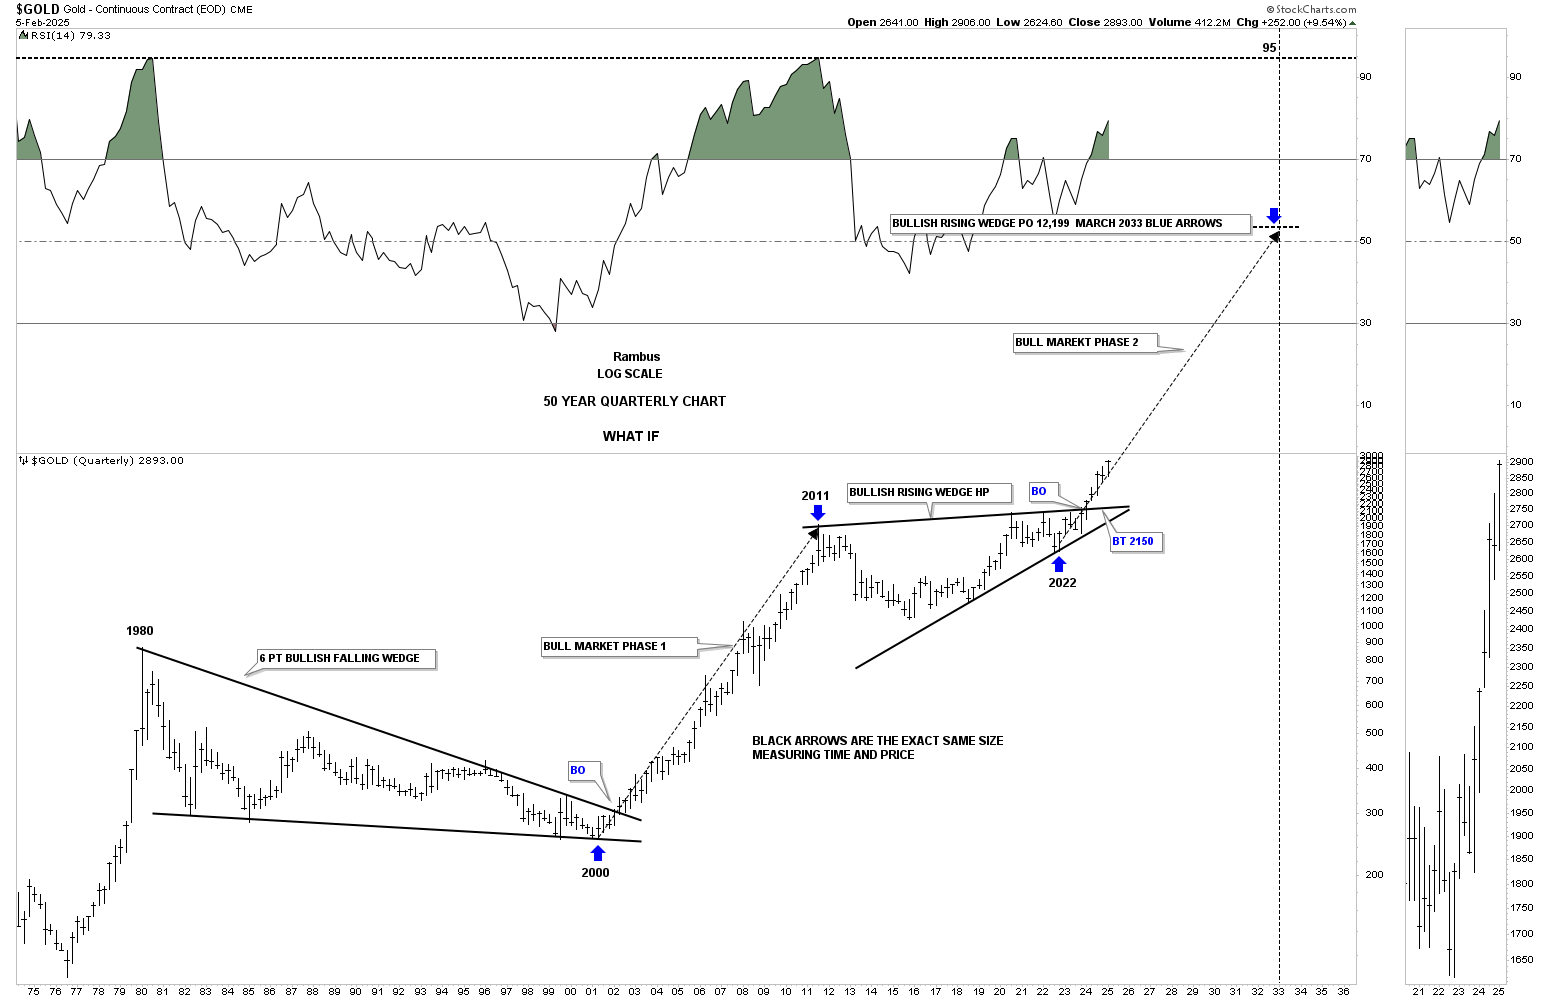 Let’s finish up by looking at several charts for silver, which is beginning to find some traction. Silver is set up just a bit differently than the rest of the PM complex. Since its 2020 high, silver has formed two very distinctive consolidation patterns. This weekly chart shows a very symmetrical H&S consolidation pattern, which has a minimum price objective up to the $40 area.(Click on image to enlarge)
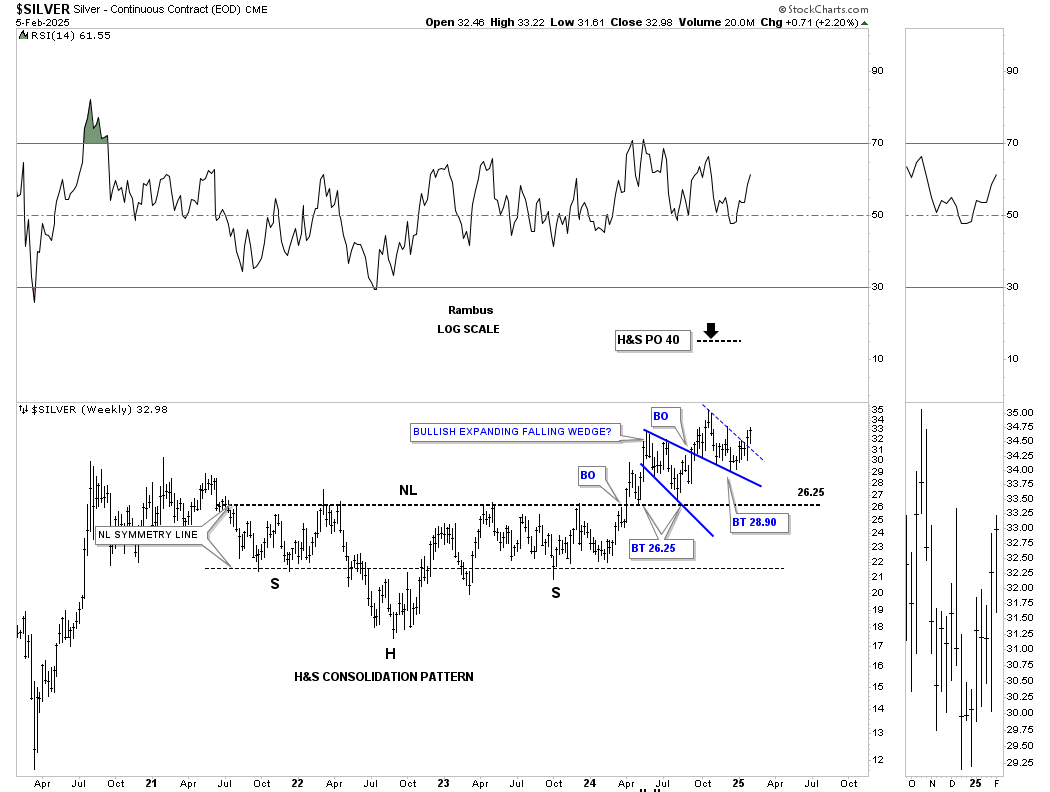 This long-term monthly chart shows silver’s secular bull market uptrend channel, which actually started about two years later than gold and the PM stocks indexes. Looking at the right side of the chart, you can see the dominant chart pattern we looked at earlier, which is the 2020 bullish expanding falling wedge. Note how close silver is trading to its previous high, made about 4 months ago. If that high is taken out, you would have to go back over ten years to see silver trade that high again.(Click on image to enlarge)
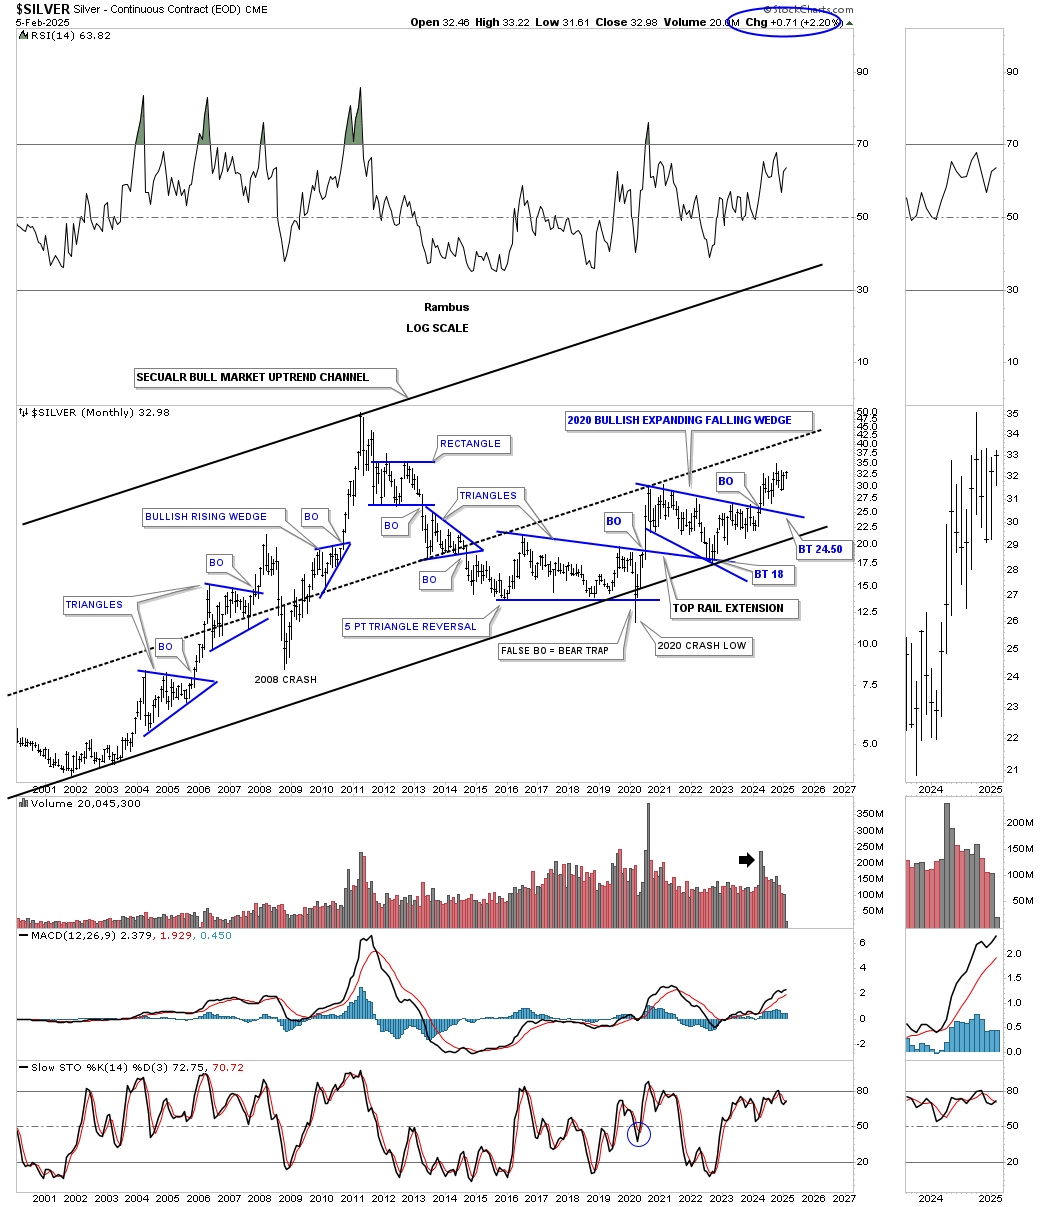 For perspective, below is the quarterly line chart for silver, which shows you just how high the current price action is versus its past on a quarterly line chart perspective. If you see any type of trading range on a quarterly line chart, then you know it will most likely play out, as it takes out all the noise from a bar chart.(Click on image to enlarge)
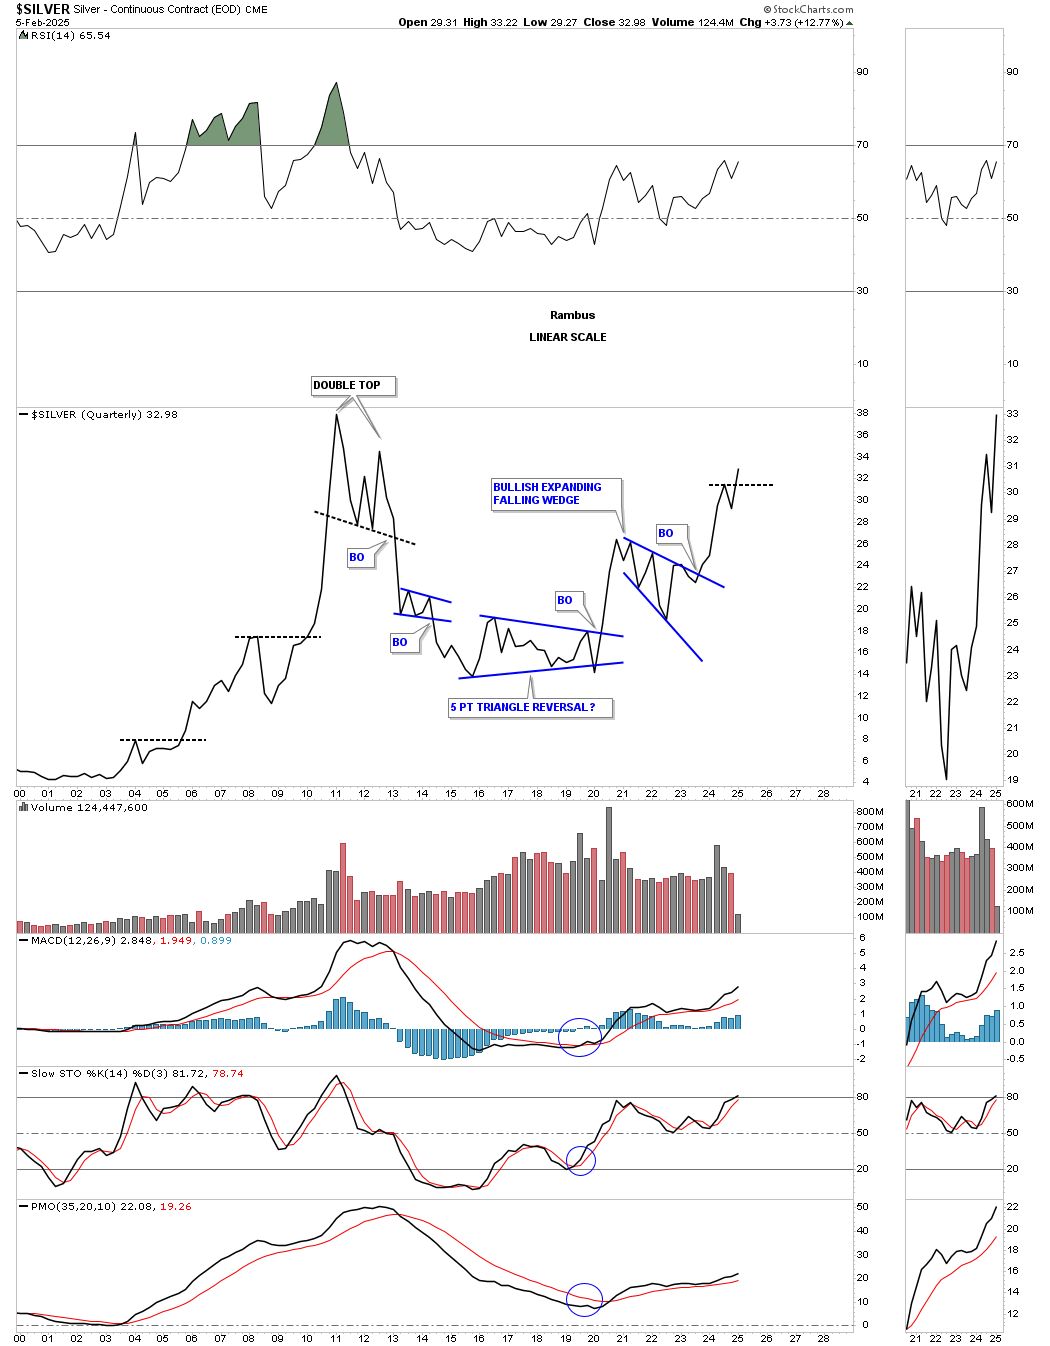 I would like to show you two more very large consolidation patterns that are strongly suggesting that the PM complex will have many years to go in its secular bull market, which began in 2000.This next chart is a combo chart, which has silver on top and gold below. I realize how hard it will be for many of you to grasp the significance of these 2011 H&S consolidation patterns, but we’ve been following these two H&S patterns since their right shoulder low.As we know, gold has been much stronger than the rest of the PM complex, as shown by the up-sloping neckline vs. silver’s down-sloping neckline. Gold has been trading in new all-time high territory since breaking out from its neckline, vs. silver, which is only halfway to its all-time high at $50.What is interesting about these two very similar 2011 H&S patterns, with different sloping necklines, is that they both broke out above their respective necklines at about the same time, which I find pretty amazing.(Click on image to enlarge)
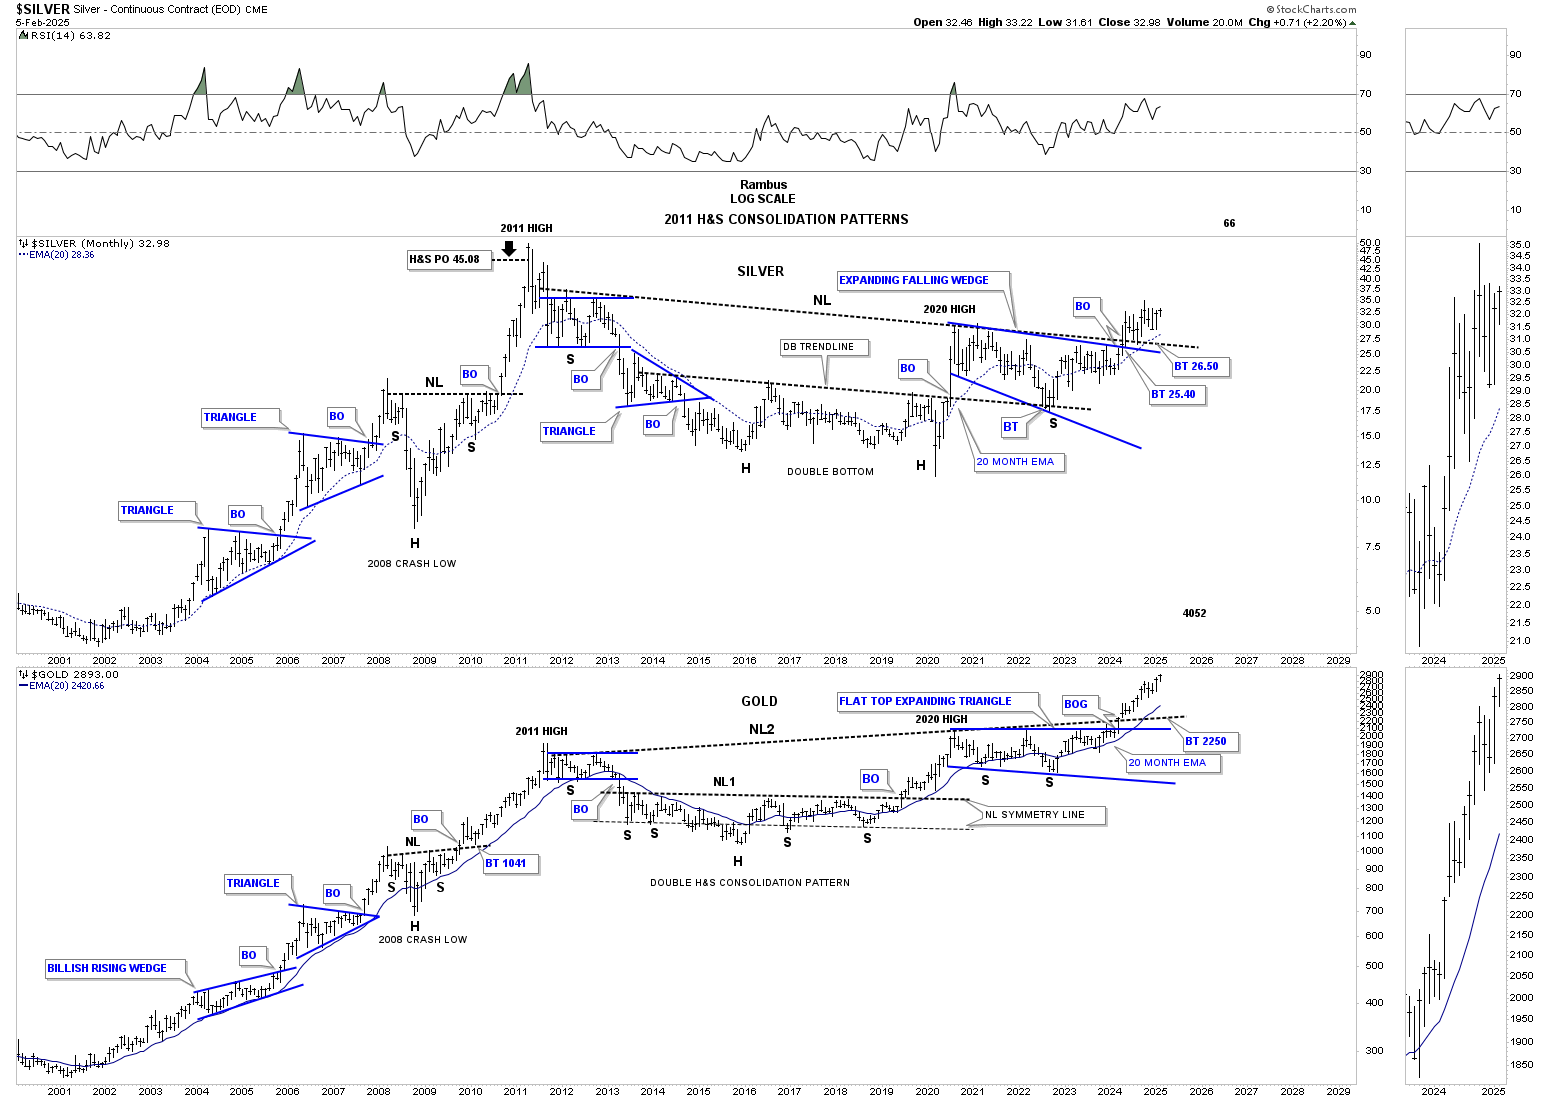 This last chart for tonight is a weekly ratio chart, which compares gold to the US dollar. We know that there is an inverse relationship between gold and the US dollar and the PM complex in general. What this weekly chart is showing us is that gold has been outperforming the US dollar since breaking out from the 2011 halfway triangle consolidation pattern and is very close to making a new all-time high.On the left-hand side of the chart, you can see how gold massively outperformed the US dollar from the 2000 low to the 2011 high, forming one consolidation pattern on top of the previous one.I have shown you many very large consolidation patterns tonight, going back to the 2011 high, which was the first leg up in the PM complex secular bull market. With the completion of those 2011 consolidation patterns, the second leg up is underway, which is going to last into the 2030s. How high the PM complex will go is yet unknown, but it should be a very exciting ride.(Click on image to enlarge)
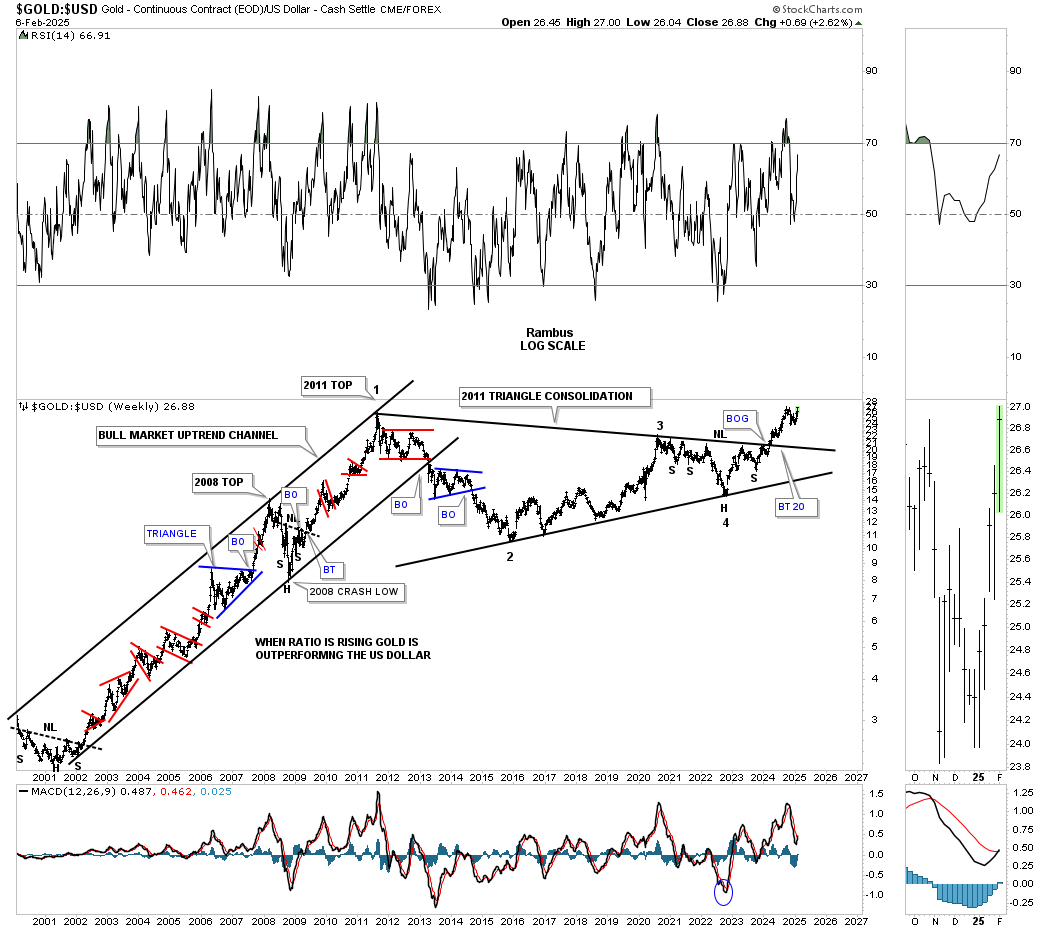 Weekend Report: Gold’s Confirmed BreakoutPM Complex Update…The Bottoms InWeekend Report: PM Complex: The Good The Bad And The Ugly


